Trends + Interpretation of 2022 CME Corn, Soybean and HRW Wheat Futures (as of 12/23/2022)

This Weekly Grain Market Review for Friday, December 23, 2022 is provided by KSU Extension Agricultural Economist Daniel O’Brien. The USDA World Agricultural Outlook Board (WAOB) released it’s latest World Agricultural Supply and Demand Estimates (WASDE) on December 9th, with the next USDA WASDE report to be released on Thursday, January 12, 2023.

I. CME Corn Futures: 12/22/2022 Closes, Spreads + 2022 Highs & Lows

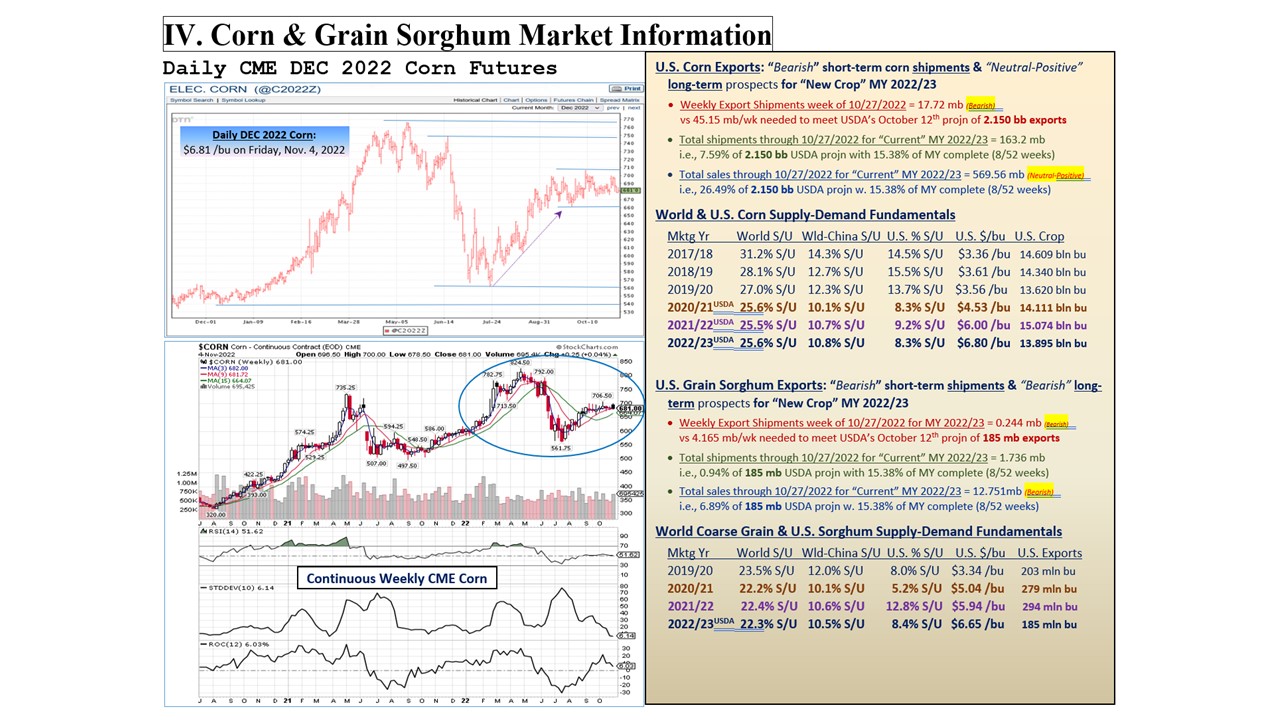
  • CME Corn Futures: The current lead CME MARCH 2023 Corn futures contract closed at $6.60 1/2 per bushel on Thursday, December 22nd – down $0.0175 from the previous day. Thursday, December 22nd was the last trading day before the 2022 Christmas holiday. “New Crop” DEC’23 Corn futures closed at $6.01 1/4 – down $0.01 from the previous day. This MAR’23-DEC’23 decline of $0.59 /bu. (down 9%) shows that as of December 22, 2022 the U.S. corn trade implicitly “expects” at least a moderate improvement in U.S. and Global corn supply-demand balances, with the likelihood of lower prices occurring – all else being equal.
  • Corn Futures Carry: On Thursday, December 22nd there were no positive carrying charges across CME Corn futures contracts in year 2023 – providing no incentive for farmers to store grain for later sale in 2023 (from a futures price perspective). The MAR’23-MAY’23 spread is a negative 1/4 cent – from $6.60 1/2 to $6.60 1/4 per bushel. The MAY’23-JULY’23 spread is a negative 6 cents/bu (-$0.03 /bu/mo) – providing a negative incentive for storage of cash grain from now into Spring-early Summer 2023. Then there is anticipation that the 2023 U.S. corn market will move lower into Fall 2023 likely due to a successful 2023 crop, with the JULY’23-SEPT’23 spread being negative seasonally at minuse 39 1/2 cents/bu (-$0.19 5/8 /bu/mo). Then moving into the Fall 2023 harvest, the SEPT’23-DEC’23 spread is a negative 13 3/4 cents/bu into harvest (-$0.04583 /bu/mo) – representing a conventional, traditional “fall harvest low” being expected by the market in year 2023.
  • CME Corn Futures Price Action since During 2022:
    • At the start of 2022, the CME MAR’22 Corn lead contract closed the week ending on January 7th at $6.06 3/4 per bushel
    • Then in the midst of global grain market concerns about how the Ukraine-Russia war may impact grain markets, CME MAY’22 Corn traded as high as $8.25 1/2 per bushel before closing at $8.13 1/2 for the week ending April 29, 2022.
    • Concerning the grain market impact of the Black Sea geopolitical conflict, market fears and concerns about the war’s impact was less immediate and acute during the week ending July 22, 2022. Also, eastern and central U.S. Corn Belt crop prospects became less worrisome. As a result, CME SEPT’22 Corn futures traded as low as $5.61 3/4 before closing at $5.64 1/4 per bushel for the week.
    • Following the July 2022 low, corn futures prices trended higher, with CME DEC’22 Corn futures trading as high as $7.06 1/2 /bu during the week of October 14th before closing at $6.89 3/4 per bushel
    • Through mid-to-late December 2022, during the week closing on December 23rd, CME MAR’23 Corn closed at $6.66 1/4 per bushel.
      • The 12/23/2022 lead corn futures closing price is up $0.59 1/2 per bushel from $6.06 3/4 for MAR’2022 during the first week of January, 2022.

II. CME Soybean Futures: 12/22/2022 Closes, Spreads + 2022 Highs & Lows

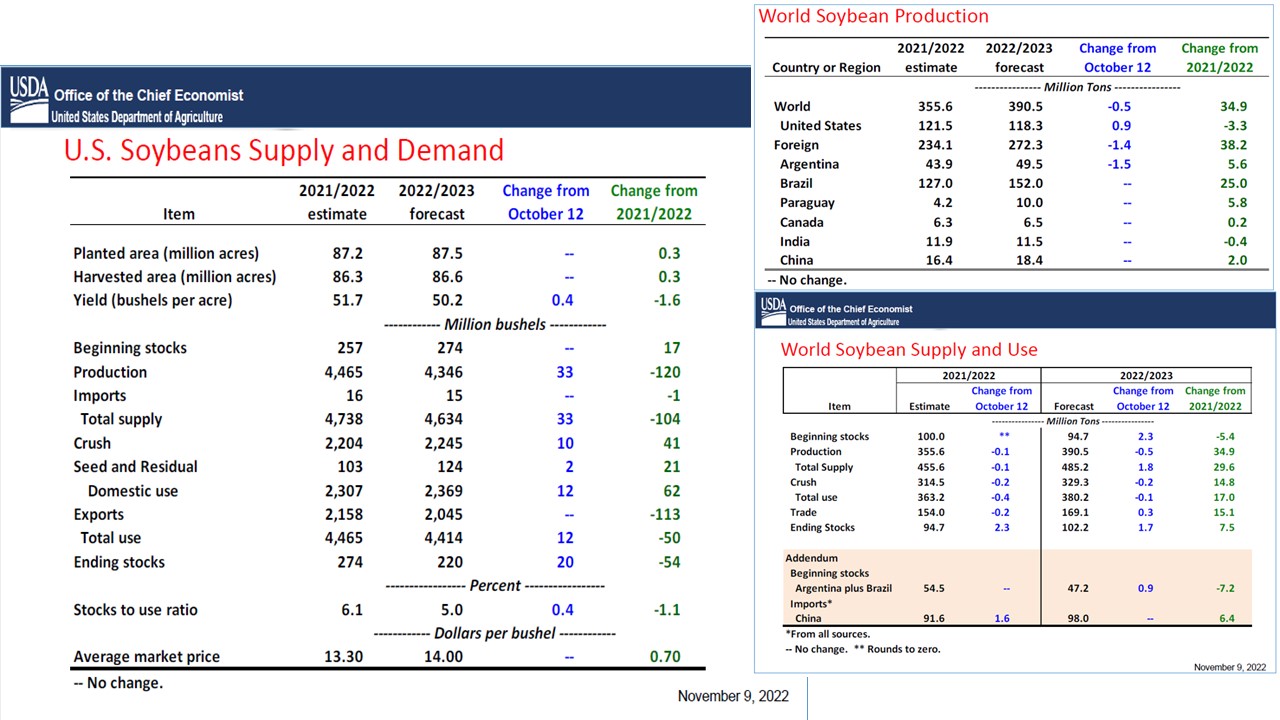
  • CME Soybean Futures: The current lead JANUARY 2023 CME Soybean futures contract closed at $14.67 3/4 per bushel on Thursday, December 22nd – down $0.1325 from the previous day. “New Crop” NOV’23 Soybean futures closed at $13.81 3/4 – down $0.08 3/4 the same day. Similar to the corn market, this JAN’23-NOV’23 decline of $0.86 /bu. (down 5.9%) shows that as of December 22, 2022 the U.S. soybean trade collectively “expects” at least a moderate improvement in U.S. and Global soybean supply-demand balances, with a moderate decline in soybean market prices by the end of year 2023.
  • .
  • Soybean Futures Carry: As of December 22nd, there were moderately positive carrying charges across CME Soybean futures contracts through early summer in year 2023 – providing some small and limited incentive to store soybeans for later sale in Spring-early 2023 from a futures price perspective. The JAN’23-MAR’23 spread is a positive 4 1/4 cents (up $0.02 1/8 /bu/mo) from prices of $14.67 3/4 to $14.72 per bushel, respectively. The MAR’23-MAY’23 spread is also a positive 3 3/4 cents/bu (+$0.01 7/8 /bu/mo.), and the MAY’23-JULY’23 spread is also a positive 2 1/4 cents/bu (+$0.01 1/4 /bu/mo.) These positive carries provide small positive incentives for storage of cash soybeans from now into Spring-early Summer 2023. Then there is anticipation that the 2023 U.S. soybean market will move lower from Summer into Fall 2023 with presumptions of successful 2023 soybean crops in the U.S. and South America, with the JULY’23-AUG’23 spread being negative seasonally by $0.19 3/4 /bu, and the AUG’23-SEPT’23 spread also sharply negative by $0.51 1/2 /bu/mo. Moving into the Fall 2023 harvest, the SEPT’23-NOV’23 spread is a negative 25 1/4 cents/bu into harvest (-$0.12 1/8 /bu/mo) – representing a conventional, traditional “fall harvest low” being expected in year 2023 (just as for corn futures).
  • .
  • CME Soybean Futures Price Action since During 2022:
    • At the start of 2022, the CME MAR’22 Soybeans lead contract closed the week ending on January 7th at $14.10 1/4 per bushel.
    • Due to issues related to the availability of the 2022 South American soybean crops to World export markets, MARCH’23 Soybean futures traded as high as $17.59 1/4 per bushel before closing at $15.84 1/2 per bushel for the week ending February 25, 2022.
    • Then during the time period of global grain market concerns about how the Ukraine-Russia war may impact grain markets, CME JULY’22 Soybeans traded as high as $17.49 1/4 per bushel before closing at $16.97 3/4 for the week ending June 3, 2022 (i.e., and indirect market effect since soybeans are not a major crop grown by Ukraine. However, Ukraine sunflower oil production and exports ARE a major concern, with cross-market impacts in the oilseed crop and co-product complex).
    • As concerns about the grain market impact of the Black Sea geopolitical conflict at least moderately diminished, and Eastern and Central Corn Belt crop prospects became less worrisome, CME AUGUST’22 Soybean futures traded as low as $12.88 1/2 before closing at $13.15 3/4 per bushel for the week ending July 22, 2022.
    • Following the July 2022 soybean market low, soybean futures prices trended higher, with CME NOV’22 Soybean futures trading as high as $15.08 3/4 /bu. during the week of September 16th before closing at $14.48 1/2 per bushel
    • Through mid-to-late December 2022, CME JAN’23 Soybeans traded as high as $14.92 3/4 per bushel for the week ending December 9th, while closing at $14.84 1/2 per bushel during the week ending December 23rd.
      • The 12/23/2022 lead soybean futures closing price of $14.84 1/2 is up $0.74 1/4 per bushel from $14.10 1/4 for CME MAR’2022 Soybeans during the first week of January, 2022.

III. CME HRW Wheat Futures: 12/22/2022 Closes, Spreads + 2022 Highs & Lows

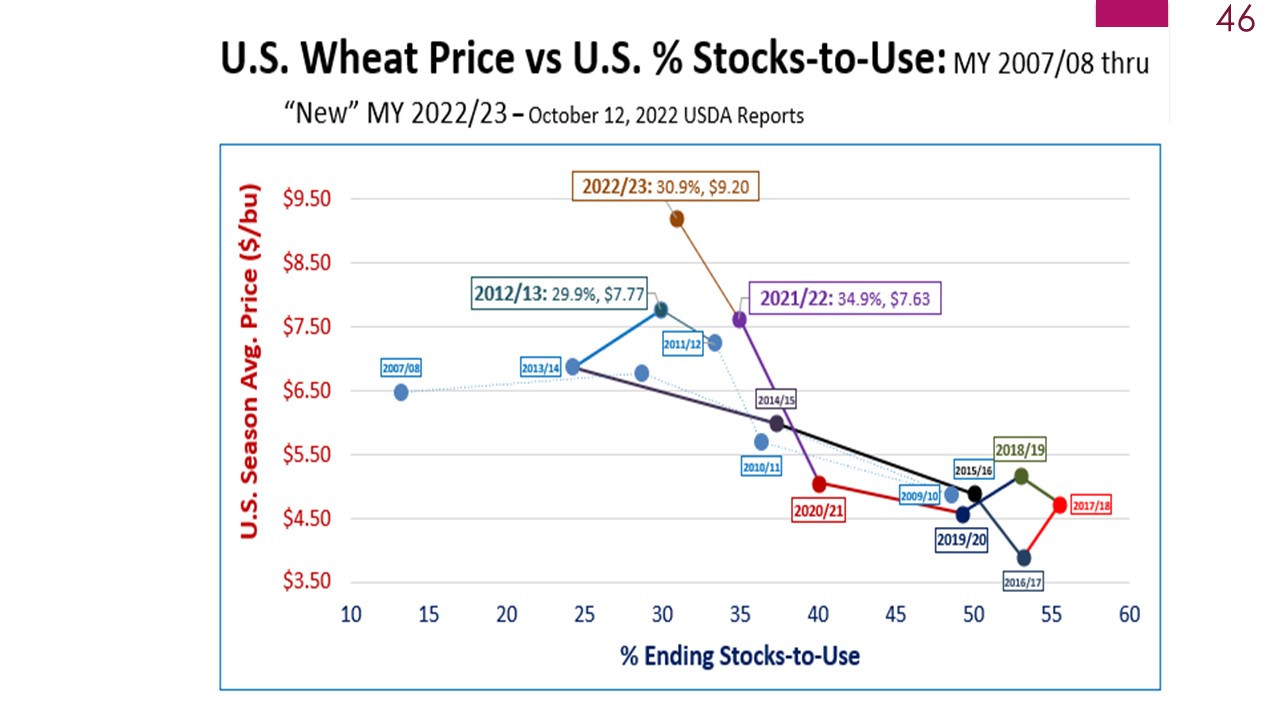
  • CME HRW Wheat Futures: The current lead MARCH 2023 CME Hard Red Winter (HRW) Wheat futures contract closed at $8.66 per bushel on Thursday, December 22nd – down $0.03 1/4 from the previous day. “New Crop” JULY’23 HRW Wheat futures closed at $8.52 3/4 – in turn up $0.03 1/2 per bushel from the previous day. This MAR’23-JULY’23 decline of $0.13 1/4 per bushel (down 1.5%) indicates that as of December 22, 2022 the U.S. & global wheat trade implicitly “expects” little if any change in U.S. and Global soybean supply-demand balances in 2023.
  • .
  • HRW Wheat Futures Carry: As of December 22nd, there were no positive carrying charges across CME Kansas HRW Wheat futures contracts through the 2023 Summer harvest – providing no incentive to store grain for later sale in 2023 from a futures price perspective. The MAR’23-MAY’23 spread is a negative 6 1/4 cents from $8.66 to $8.59 3/4 per bushel (down -$0.03 1/8 /bu/mo), & the MAY’23-JULY’23 spread is a negative 7 cents/bu (-$0.03 1/2 /bu/mo) – both of which provide a negative incentive for farmer storage of cash wheat from now into summer harvest in July 2023. Then, during the post-harvest period there is anticipation that the 2023 U.S. HRW Wheat market will move sideways-to-higher after Summer 2023 harvest lows into Fall & early Winter 2023, with the JULY’23-SEPT’23 spread being only a positive 1/2 cent/bu (+$0.00 1/4 /bu/mo). Similarly, the SEPT’23-DEC’23 spread is a positive 3 1/4 cents/bu into the end of the year (+$0.01083 /bu/mo) – representing a very small positive carrying charge during the post-harvest period.
  • .
  • CME Kansas Hard Red Winter (HRW) Wheat Futures Price Action since During 2022:
    • At the start of 2022, the CME MAR’22 HRW Wheat lead contract closed the week ending on January 7th at $7.75 per bushel.
    • Market prices rose into the week ending March 11, 2022, when MAY’23 HRW Wheat futures traded as high as $12.99 1/2 per bushel before closing at $10.89 1/4 per bushel. Prices rose again through the week ending on May 20, 2022, with CME JULY’22 HRW Wheat trading to a high of $13.79 1/4 per bushel, closing at $12.52 3/4 per bushel.
    • Diminishing concerns about the impact of the Black Sea geopolitical situation on global wheat and food supplies, lead to weakening prices during the week ending July 22, 2022 – during which CME SEPT’22 HRW Wheat traded as low as $8.14 1/2 per bushel before closing at $8.20 1/4 per bushel. Another price low occurred during the week ending on August 19th, with CME SEPT’22 HRW Wheat trading as low as $8.08 1/2 per bushel, before closing at $8.47 per bushel.
    • Following the July and August lows, wheat prices futures prices trended higher, with CME DEC’22 HRW Wheat futures trading as high as $10.37 1/2 /bu during the week of October 14th before closing that week at $9.52 1/4 per bushel
    • Through mid-to-late December 2022, CME MAR’23 HRW Wheat traded as low as $8.21 3/4 per bushel for the week ending December 9th, while closing at $8.74 3/4 per bushel during the week ending December 23rd.
      • This 12/23/2022 lead Kansas HRW Wheat futures closing price of $8.74 3/4 per bushel is up $0.99 3/4 per bushel from $7.75 for CME MAR’2022 HRW Wheat during the first week of January, 2022.

………

Following are the supportive working slides and notes for the Weekly Grain Market Review from Kansas State University (updated through market trades on Friday, December 22, 2022:

Grain Highlights of the December 9th USDA WASDE Report

This Weekly Grain Market Review for Friday, December 9, 2022 is provided by KSU Extension Agricultural Economist Daniel O’Brien. The USDA World Agricultural Outlook Board (WAOB) released it’s latest World Agricultural Supply and Demand Estimates (WASDE) on Friday, December 9th.

A. Key USDA-WASDE results for COARSE GRAINS from the December 2022 WASDE report are described below in the report:

COARSE GRAINS: This month’s 2022/23 U.S. corn outlook is for lower exports and greater ending stocks. Exports are lowered 75 million bushels as competition from other exporters and relatively high U.S. prices have resulted in slow sales and shipments through early December. With no other use changes, corn ending stocks are raised 75 million bushels. The season-average corn price received by producers is lowered 10 cents to $6.70 per bushel based on observed prices to date.

For 2022/23 sorghum, a substantial decline in demand from China supports greater domestic use expectations. Exports are lowered 20 million bushels, with offsetting increases to food, seed, and industrial and feed and residual use.

The 2022/23 foreign coarse grain outlook is for lower production, greater trade, and smaller stocks relative to last month.

B. USDA-WASDE results for OILSEEDS are as follows:

Total U.S. oilseed production for 2022/23 is forecast at 127.9 million tons, up slightly due to an increase for cottonseed. Soybean supply and use projections for 2022/23 are unchanged from last month. Based on a review of EPA’s recent proposed rule for renewable fuel obligation targets, soybean oil used for biofuel for 2022/23 is reduced 200 million pounds to 11.6 billion.

Soybean oil exports are also reduced on historically low export sales through November. With reduced use of soybean oil for biofuel and exports, food use and ending stocks are raised. The U.S. season-average soybean price forecast is unchanged at $14.00 per bushel. The soybean oil price is reduced 1 cent per pound to 68 cents. The soybean meal price forecast is increased $10.00 to $410.00 per short ton.

Lower sunflower, rapeseed, palm kernel, and cottonseed production forecasts are partly offset by higher soybean output. The global soybean outlook includes higher production, exports, and ending stocks.

C. Key WHEAT-related USDA-WASDE results are:

This month’s 2022/23 U.S. wheat supply and use outlook is unchanged from last month. There are offsetting changes for exports by-class with Hard Red Spring and White higher and Soft Red Winter lower. The 2022/23 season-average farm price is forecast $0.10 per bushel lower at $9.10, based on prices received to date and expectations for futures and cash prices for the remainder of 2022/23. …… The global wheat outlook for 2022/23 wheat is for reduced supplies, lower consumption, increased trade, and reduced stocks.

Following are the supportive working slides and notes for the Weekly Grain Market Review from Kansas State University (updated through market trades on Friday, December 9, 2022):

“Reticently Passive” Grain Market Situation Heading into the December 9th WASDE Report

This Weekly Grain Market Review for Friday, December 2, 2022 is provided by KSU Extension Agricultural Economist Daniel O’Brien.

Grain market prices are lacking positive impetus for the most part ahead of the USDA’s December 9, 2022 World Agricultural Supply and Demand Estimates (WASDE) report. To a degree, it may be that anticipated reductions in USDA forecasts of U.S. corn, grain sorghum and wheat exports (with subsequent increases in ending stocks – all else being equal) are being factored into grain futures prices ahead of the upcoming WASDE. Conversely, relatively positively movement in U.S. soybean exports are providing support for soy futures prices.

There will be more to comment on after the December 9th USDA report. However, world grain markets are wracked with uncertainty at the moment, with protests in Brazil likely to eventually slow grain transportation logistics to the ports, and drought in Argentina damaging crop production while at the same time the Argentine government is incentivizing old crop soybean exports. Problems continue between Ukraine & Russia that is reducing Ukraine crop production prospects in the coming year and slowing / reducing Ukrainian old crop exports. Russia has large supplies of crops to exports, but is dealing with problems from financial sanctions.

Reduced fertilizer use in major crops in 2023 because of either supply shortfalls, high fertilizer input costs or increasingly limiting environmental regulations which seek to limit green house gases by reducing fertilizer usage (i.e., in Europe, Canada, and elsewhere) may be a currently under appreciated factor in crop supply-demand projections for 2023. In the long run, can yield increases from improved plant genetics and advancements in cropping system production practices offset lowering of crop production from limited fertilizer usage? That may be the underappreciated question of the next several years in crop markets going forward.

Although current price trends are sideways to lower for feedgrains and wheat, and up for soybeans, still it seems that the grain trade has “lost its appetite” for highly volatile grain price movements – at least until it may eventually be unable to avoid having to deal with whatever issues may come up that are unavoidable.

Following are the supportive working slides and notes for the Weekly Grain Market Review from Kansas State University (updated through market trades on Friday, December 2, 2022):

U.S. Ethanol Market Trends and Profitability through Mid-November 2022

Daniel M. O’Brien – Professor and Extension Agricultural Economist, Kansas State University Department of Agricultural Economics

Ethanol Price and Profitability Trends – Through November 18, 2022

Ethanol Sales Prices (per gallon): The selling price of ethanol via tank car and truck shipment out of Iowa ethanol plants is estimated to have averaged $2.32 / gallon during the November 14-18, 2022 period, down from $2.63 and $2.49 per gallon for the previous two weeks in November.  For the November 1-18 period, ethanol prices averaged $2.48 per gallon, which compares to $2.35 per gallon for the month of October.

  • Corn Input Purchase Prices (per bushel): The price paid for corn at Iowa ethanol plants during November 14-18, 2022 averaged $6.76 per bushel, compared to $6.77 and $6.92, respectively, the previous two weeks. The average corn price paid of $6.82 for November 1-18 compares to $6.89 1/4 in October and $7.11 in September 2022.
  • DDGS Market Prices (per ton at 10% moisture): During the November 14-18, 2022 period, distillers dried grains (DDGS) prices (10% moisture) for Iowa ethanol plants averaged $214.81 per ton, down from $223.61 and $229.17, respectively, per ton during the previous two weeks.  The November 1-18, 2022 average DDGS price of $222.53 per ton is down from $245.08 in October and $254.98 per ton in September 2022.
  • Ethanol Cost of Production (per gallon): During mid-November (11/14-18/2022) the estimated cost of production for Iowa ethanol plants was $2.46 per gallon – compared to an estimate of $2.46 for November 1-18, $2.41 for October, and $2.46 for September 2022.
  • Profitability of Ethanol Production (per gallon): Using an Iowa State University model and applying input cost and product price estimates from the USDA Agricultural Marketing Service, ethanol plants in Iowa were operating on average at estimated loss of (-$0.14) per gallon during the November 14-18, 2022, whereas the first two weeks of the month were more profitable, bringing the November 1-18, 2022 average profitability was +$0.03 per gallon. This compares to average losses of (-$0.06) in October, and (-$0.07) in September, 2022.
  • The Estimated Processing Value (EPV) of corn used in ethanol production is calculated by adding the total value from Ethanol, Dried 10% Distillers Grains, and Distillers Corn Oil. During November 14-18, 2022 at Iowa Ethanol Plants the corn EPV averaged $8.85 per bushel, down from $9.80 and $9.45, respectively, the previous two weeks in November.  This compares to a corn EPV average value of $9.16 in October, and $9.35 1/4 per bushel in September 2022.
  • Distillers Corn Oil Value per gallon of Ethanol: At an average value of $0.48 per bushel of corn used in ethanol production during November 14-18, 2022, the value of Corn Oil per gallon is calculated by dividing $0.48 per bushel by 2.83 gallons per bushel, equaling approximately $0.1696 per gallon in added income per unit of ethanol produced.  This compares to $0.1661 per gallon for November 1-18, $0.1555 in October, and $0.1546 per gallon in September 2022.
    • For ethanol plants that DO produce Distillers Corn Oil, projected losses of -$0.14 per gallon during November 14-18, 2022 without corn oil revenues included, may come near to profits of approximately +$0.0296 per gallon for the week with Distillers Corn Oil revenues included.
      • During the November 1-18 period, estimated ethanol plant profits of $0.03 per gallon without corn oil revenues accounted for would be increased to $0.1961 per gallon in profits.
      • In comparison, during October, projected losses of -$0.06 per gallon without corn oil revenues may come near to profits of approximately +$0.0955 per gallon for the period, with a similar outcome for September 2022 of +$0.0846 per gallon profits with corn oil revenues accounted for.

******

Following are some graphics on U.S. Ethanol Market price and profitability trends.

“Steady” Grain Markets with Uncertain Underpinnings on 11/18/2022

This Weekly Grain Market Review for Friday, November 18, 2022 is provided by KSU Extension Agricultural Economist Daniel O’Brien.

Although there are a number of critically important and potentially volatile factors affecting grain markets at this time, over the last few weeks a “steadiness” has characterized price movements. These underlying and potentially volatile grain market issues are as follows:

a) Uncertainty about corn and wheat trade prospects from Ukraine involving Russia has not seemed to shake grain market perspectives appreciably in recent weeks.

b) Dry conditions in Argentina that impacting wheat and other crop prospects were at least temporarily alleviated with timely rains – although a return of dry weather is forecast in coming weeks. News of the Argentine government taking action to increase crop exports via currency adjustments just came into the market on Friday, November 18th.

c) Disruptions of U.S. grain river barge shipments due to drought and resulting low river water levels in the central and eastern U.S. Corn Belt have hurt U.S. grain export capacity through U.S. Gulf ports – but not caused appreciable grain price volatility at interior markets. At least not yet. Still, U.S. soybean exports have been a demand bright spot for U.S. grain markets, with basis levels in Kansas being positively impacted – likely indicative of demand-pull via rail from usually “Plan B” sources in the western Corn Belt of soybeans going to the U.S. Gulf.

d) The renewed threat of a U.S. Union Rail Strike has been largely discounted by grain markets – with the expectation that the U.S. government would step in and mandate rail services should Unions decide to vote for such an action.

e) Extremely dry conditions in U.S. winter wheat production areas for all winter wheat classes (hard red winter in the central and southern plains, and soft red winter in the central and eastern Corn Belt) hs not as of yet been a major source of wheat market price volatility at this time. Although these conditions HAVE supported high wheat prices – it has not been causing consistent market volatility in recent weeks. Meanwhile, exports of U.S. wheat have been extremely weak in the current marketing year – with U.S. domestic market support coming largely from the record tight and volatile global wheat supply demand situation.

f) Extremely tight feedgrain supplies in the western Corn Belt is evidenced by very strong corn basis levels, and by a strong uptrend in grain sorghum basis levels in the region. The strength in corn and sorghum basis is happening at the same time that U.S. corn and sorghum exports are “anemic” to very poor. Domestic corn demand is leading the market at this time. Likely, grain sorghum is being used in ethanol plants in the area – a step away from reliance on Chinese grain sorghum imports that had characterized U.S. grain sorghum demand in recent years.

g) As discussed in the points above, it is likely that weak U.S. corn, sorghum and wheat exports will be reflected in the upcoming December 9, 2022 USDA World Agricultural Supply and Demand Estimates (WASDE) report. If this happens and assuming that feed and domestic processing use is not increased appreciably, it is likely that as projected U.S. corn, sorghum and wheat exports may be lowered, forecast ending stocks will increase. It is very possible that the grain markets will interpret such increases in ending stocks for the current 2022/23 marketing years for these crops negatively – causing some weakness in grain prices in mid December 2022 following the December 9th WASDE report.

Overall, if it weren’t for all the “at risk” underlying factors in the market, a person could almost say that the last few weeks have “felt like February” in the grain markets – February quite often being an anemic to weak time in U.S. grain marekts. Whatever factor comes up to threaten to more the markets one way or another hasn’t seemed to “pan out” – and grain prices have kept moving mostly sideways. Given this risky environment and the tight supplies in all these grain markets, this “flat line” situation is unlikely to endure without interruption over the next several months. BUT until one of these factors actually DOES cause a change in the underlying market narrative that “it will all work out”, grain markets seem likely to continue their sideways path.

Following are the supportive working slides and notes for the Weekly Grain Market Review from Kansas State University (updated through market trades on Friday, November 18, 2022):

Tight Global Grains and High Prices – but with bothersome “headwinds” on 11/10/2022

This Weekly Grain Market Review for Thursday, November 10, 2022 is provided by KSU Extension Agricultural Economist Daniel O’Brien.

Although the USDA made a number of supply-demand balance sheet changes in its November 9th World Agricultural Supply and Demand Estimates (WASDE) report, there were no adjustments that markedly impacted the perspective of U.S. and World grain markets regarding current market prospects in the short and long run.

Wheat Markets:

Projected “Current” 2022/23 Marketing Year U.S. wheat ending stocks of 571 million bushels (mb) at 30.57% Stocks/Use are down from 669 mb (34.90% S/U) for “old crop” MY 2021/22, and 845 mb (40.03% S/U) for MY 2020/21. The “current” MY 2022/23 U.S. wheat average farm price is projected to be $9.20 /bu, up sharply from $7.63 /bu last year, and $5.05 /bu two years ago.

In the global wheat market, “World-less-China” ending stocks of 123.46 million metric tons (mmt) (19.08% S/U) in “current” MY 2022/23 are historically low – compared to 134.55 mmt (20.84% S/U) one year ago, and 146.53 mmt (23.18% S/U) two years ago.

Overall, global Wheat markets are extremely tight – “raising the stakes” and potential market impacts of further geopolitical conflicts between Ukraine and Russia. Also, excessive moisture in eastern Australia wheat growing areas, drought damage to the Argentina wheat crop, and drought conditions in the U.S. central and southern plains winter wheat areas, are other key wheat market factors to monitor.

Corn and Sorghum Markets:

Projected “Current” 2022/23 Marketing Year U.S. corn ending stocks of 1.182 billion bushels (bb) at 8.34% Stocks/Use are equal to or down from 1.377 bb (9.21% S/U) for “old crop” MY 2021/22, and 1.235 bb (8.33% S/U) for MY 2020/21. The “current” MY 2022/23 U.S. average corn farm price is projected to be $6.80 /bu, up from $6.00 /bu last year, and $4.53 /bu two years ago.

In the global corn market, projected “World-less-China” ending stocks of 94.64 million metric tons (mmt) (10.75% S/U) in “current” MY 2022/23 are historically low – compared to 98.54 mmt (10.81% S/U) one year ago, and the Brazilian drought year of 87.10 mmt (10.14% S/U) two years ago.

Overall, global corn markets tightened considerably in the historically “tight” marketing year of MY 2020/21 – and have not been able to rebuild global corn stocks since that time. Lagging U.S. corn exports – impacted by slow barge traffic on the Mississippi River system due to drought, and signals from Mexico that it will cease purchases of GMO corn from the U.S., are a hindrance to the corn market. Anticipated inflation in U.S. and global corn cost of production from fertilizer, fuel, seed, pesticide and other input cost increases, are likely to factor in to 2023 corn production plans “everywhere” – in the U.S. and beyond. Limited Ukraine corn exports are also likely to impact U.S. corn prices over the coming months.

U.S. sorghum prices are projected to average $6.65 /bu at the farm level in “current” MY 2022/23, up from $5.94 /bu last year, and $5.04 /bu two years ago. It could be that U.S. sorghum exports benefit from Mexico’s recent choice to not import GMO corn from the U.S.. With its non-GMO status and ready substitute-ability for corn in livestock feed rations and bioenergy uses, U.S. grain sorghum may be well positioned to gain export market share for as long as Mexico’s recently announced non-GMO feedgrain import policy remains in place.

Soybean Markets:

Projected “Current” 2022/23 Marketing Year U.S. soybean ending stocks of 220 mb at 4.98% Stocks/Use are down from 274 mb (6.14% S/U) for “old crop” MY 2021/22, and 257 mb (5.71% S/U) for MY 2020/21. The “current” MY 2022/23 U.S. average soybean farm price is projected to be $14.00 /bu, up from $13.30 /bu last year, and $10.80 /bu two years ago.

In the global soybean market, projected “World-less-China” ending stocks of 70.67 mmt (26.81% S/U) in “current” MY 2022/23 are near historic lows – compared to the recent low of 62.88 mmt (24.57% S/U) one year ago, and 68.89 mmt (27.44% S/U) two years ago.

Similar to corn, global soybean markets tightened considerably in the historically “tight” marketing year of MY 2021/22 – and just as with corn have not been able to rebuild global soybean stocks since that time. U.S. soybean exports have been strong in recent weeks, unlike the slow export situation for U.S. corn, sorghum and wheat. Anticipated inflation in U.S. and global soybean cost of production from non-nitrogen fertilizers, fuel, seed, pesticide and other input cost increases, are likely to factor in to 2023 soybean production plans just as for corn – in the U.S. and beyond. Uncertain Chinese import demand for soybeans is an important factor in forming expectations for U.S. and foreign export markets in 2023.

Following are the supportive working slides and notes for the Weekly Grain Market Review from Kansas State University (updated through market trades on Thursday, November 10, 2022):

Strong Kansas Soybean Basis – Covering for Low River-Limited Eastern Corn Belt Supplies on 11/4/2022

This Weekly Grain Market Review for Friday, November 4, 2022 is provided by KSU Extension Agricultural Economist Daniel O’Brien. The soybean basis at key eastern and central Kansas market locations has surged higher within the last 1-2 weeks. As low water levels in the U.S. river system in the eastern and central Corn Belt has limited U.S. barge traffic of grain to the U.S. Gulf, a surge of basis strength has occurred in such critically important Kansas export-oriented grain elevators as Salina (North Central), Topeka (Northeast-East Central), Hutchinson (South Central) and Columbus (Southeast) – as basis is strong and positive in each of these locations – an extremely uncommon occurrence in the Kansas soybean market seasonally. Soybean basis is strong in the western part of the state as well, but still is negative (under futures) in Garden City-Hugoton (Southwest) and Colby (Northwest). This strengthening of soybean basis levels in Western Kansas is likely to continue until barge traffic to the gulf increases again OR until available supplies of soybeans in the western Corn Best are exhausted.

Corn basis levels across Kansas continue to be contra-seasonally strong – with drought damaged corn and sorghum crops in the state tightening up local/regional supplies, and causing a “mad scramble” by area feedgrain users to secure whatever supplies that are available at historically high prices. There are concerns about having adequate supplies of corn and sorghum in these areas to hold these users over without disrupting their livestock feeding, ethanol production, and export demand until new feedgrain supplies become available in Fall 2023.

Kansas wheat basis levels continue to be mostly sideways since the July 2022 harvest. This has actually been a constructive achievement given the ongoing weakness of U.S. wheat exports in 2022. Kansas wheat seeding is nearing completion (87% done as of October 30th versus 88% 5 year average), while wheat emergence of 58% trails moderately behind the 5 year average of 67% on this date in Kansas. The U.S. and World wheat markets will be closely watching the establishment of hard red winter wheat stands in the western Corn Belt both for the remainder of 2022, and especially in spring 2023 as the crop breaks dormancy (usually March) to assess crop prospects for the coming the year.

Following are the supportive working slides and notes for the Weekly Grain Market Review from Kansas State University (updated through market trades on Friday, November 4, 2022):

Weekly Grain Market Review on 10/30/2022 (by Kansas State University)

This Weekly Grain Market Review for Sunday, October 30, 2022 is provided by KSU Extension Agricultural Economist Daniel O’Brien. News from Russia this weekend that grain export shipments from Ukraine will no longer be allowed safe passage is a major factor in World corn, wheat and sunflower oil markets. Ongoing dry conditions in Argentina impacting wheat production, re-ignited worries regarding a possible U.S. rail strike impacting grain shipments, low water levels in the U.S. river system to U.S. Gulf ports curtailing U.S. barge traffic and associated grain exports, and worries about inflation and the health of the broader U.S. economy are all weighing on grain market sentiments.

The most critical issues impacting U.S. and World grain markets are the extreme tightness of corn, wheat and soybeans from the perspective of World & World less China ending stocks and stocks-to-use. Going into 2023 – unless either large crops or rationing of usage occurs, the “tight stocks syndrome” that grain markets find themselves in now will continue in 2023-2024+ until the situation is rectified.

Following are the supportive working slides and notes for the Weekly Grain Market Review from Kansas State University (updated through market trades on Sunday, October 30, 2022):

Key Wheat Market Trends Heading into 2023

The following information was developed by Daniel O’Brien, Extension Agricultural Economist for the Department of Agricultural Economics at Kansas State University on October 18, 2022. A copy of this presentation can be found at the following web address on the www.AgManager.info website.

https://www.agmanager.info/grain-marketing/presentations/wheat-market-perspectives-mid-october-2022

Key factors to consider for the U.S. and World wheat market in the remainder of year 2022 and into 2023 are as follows:

1. The Extent & Market Impact of U.S. Hard Red Winter Wheat Drought Damage in the Western and Central Plains in 2022

Through most of western and southern Kansas, as well as in Oklahoma, Texas and parts of Nebraska, Hard Red Winter Wheat production was seriously damaged in the summer of 2022. As a result, total U.S. winter wheat product in 2022 of 531 million bushels was down from 750 mb in year 2021.

2. Extremely “Tight” Global Wheat Stocks in 2022-2023

The extreme tightness of global wheat supply-demand balances in the “Current” 2022/23 marketing year (September 1, 2022 – August 31, 2023) high light the importance of successful wheat production growing seasons in the major wheat producing and exporting regions of the world, including the Black Sea region countries of Russian and Ukraine, the European Union, Australia, Canada, the United States and elsewhere.

3. Uncertainty over the Continuance of the La Nina Weather Pattern into early-mid 2023

If the current La Nina weather pattern the has existed for the last 2 years were to relent and weaken in early 2023 as many respected climatologists have forecast, it could be a very positive development for wheat and other crop production prospects in 2023. Current climate projections are for La Nina to continue though the end of 2022 on into early 2023. A reduced threat of La Nina in 2023 would be a particularly positive development for wheat and other crop prospects in North and South America, and may positively impact 2023 crop development at a time when increased wheat and other crop production is sorely needed.

4. Continued High Cost of Fertilizer and Other Crop Inputs in 2023

Although trending lower from August 2022 highs near $10 per unit down to to $6 on October 18, 2022, natural gas prices remain historically high, supporting continued high nitrogen (N) fertilizer prices into Spring 2023. Combined with ongoing fertilizer market supply chain and logistics issues coming out for Russia and challenges in obtaining fertilizer in a number of important crop producing areas of the world, the limited availability and high cost of nitrogen, phosphorous and other key fertilizer products is likely to be a significant hindrance and limitation to U.S. and global crop production enterprises in 2023.

With additional inflation in the costs of other key seed, pesticide, equipment fuel and capital costs, must less the price of interest on any borrowed operating funds, and prospects for increased costs of production pose a significant threat to the profitability of wheat and other crop production enterprises in 2023.

5. Prospects for U.S. HRW Winter Wheat Seedings Fall 2022 for Harvest Summer 2023

Two key factors determining the seedings of U.S. Hard Red Winter Wheat in Fall 2022 are 1) soil moisture prospects in the Central-Southern Plains in Fall 2022, and 2) the strength of crop insurance planning prices and associated revenue protection prospects for 2023.

Support from strong “New Crop” 2023 HRW Wheat futures & a historically strong 2023 Crop Revenue Insurance Planning Price.  The RMA Planning $ JULY23 KC HRW Wheat = $8.79 /bu @75% APH which roughly equates to $6.59 /bu @100% APH* for implicit coverage of all 100% of the cropland bushels instead of the implicit 75% coverage in this example. Estimated costs of production from Kansas State University planning budgets for 2022 are ≈ $7.25 /bu in western Kansas in wheat-summer crop-fallows rotations, and $5.58-$6.27 /bu in central and southern Kansas.    

It is likely that this historically high USDA Risk Management Agence (RMA) planning price for U.S. winter wheat will attract U.S. winter wheat seedings and lead to an increase in winter wheat seeded acres for harvest in year 2023.

6. Wheat Market Volatility To be Associated with Upcoming USDA Crop Production & WASDE reports through January 2023

USDA Report release dates coming up include USDA Crop Production & WASDE reports on November 9th and December 9th in year 2022, and early January 2023.  There is the possibly that further 2022 feedgrain & oilseed crop declines may occur in the Western & Central Corn Belt & Northern Plains.  USDA Grain Stocks & Winter Wheat Seedings are also due in January 2023.  Market surprises for wheat or other crops are likely to cause significant market volatility in the coming year.

7. Overall Price Prospects for 2023 Grain Markets

a) Grain Prices to be supported @ High Levels in MY 2022-2023until grain markets are confident of larger crops & likely rebuilding of stocks. After that, both ‘Old Crop’ Cash & ‘New Crop’ Forward Bids likely to be vulnerable to declines during late Spring – Summer2023 into 2023 Fall harvest.

b) Geopolitical Conflicts are likely to continue to impact World grain markets either directly or via indirect paths in 2023.

c) Markets to be impacted by South America Crop Development – through at least first half of 2023: Brazil & Argentina crop prospects are likely to drive U.S. crop price volatility during January-August 2023.

Market Impacts of the September 30th USDA Grain Stocks and Small Grain Summary Reports (K-State Estimates)

The USDA released its September 2022 Grain Stocks and Small Grains Summary reports on Friday, September 30th. Grain markets interpreted the results of these reports as positive for U.S. corn and wheat prices, but sharply negative for U.S. soybean market prospects. This grain market information is provided by KSU Extension Agricultural Economist Daniel O’Brien.

A. Lower 2021 U.S. Corn Crop Tightens both “Old Crop” MY 2021/22 End Stocks, & “New Crop” MY 2022/23 Supply-Demand Balances

The USDA September 1st grain stocks estimate for U.S. corn of 1.377 billion bushels was sharply below the lower end of pre-report trade estimates, and interpreted as positive toward prices by the grain trade.

The USDA estimated there to be a 41 million bushel decline in the USDA’s estimate of the 2021 U.S. corn crop – down to 15.074 billion bushels (bb). It also reduced Feed and Residual Use in “old crop” MY 2021/22 by 183 million bushels (mb) – down to 5.706 bb. Together, these changes caused a 142 mb drop in Ending Stocks for “old crop” MY 2021/22 – down to 1.377 bb, with a decline in percent ending stocks-to-use to 9.21% (down from 10.27% in the September 12th USDA World Agricultural Supply and Demand Estimates (WASDE) report).

Assuming that beginning stocks in “new crop” MY 2022/23 would now be the same 1.377 bb, and that all other supply-demand factors are unchanged, projected ending stocks in “new crop” MY 2022/23 would decline to 1.072 bb (vs 1.219 bb in the September 2022 WASDE), with percent ending stocks-to-use declining from 8.54% in the September WASDE report to 7.50% with only the beginning stocks adjustment. This projection of 7.50% ending stocks-to-use would be an 11 year low – since 7.41% in the major U.S. drought marketing year of MY 2012/13.

Corn Market Impacts: IF projected 2022 U.S. corn production is significantly lowered again by the USDA in the October 12th USDA Crop Production report, then EITHER a) projected U.S. corn stocks drop down to or below 1.000 billion bushels, OR b) market prices rise enough to “ration” or “reduce” usage of U.S. corn to preserve positive ending stocks through August 31, 2023 (i.e., the end of “new crop” MY 2022/23).

B. Lower 2022 U.S. Wheat Production & September 1 Stocks Tighten the “New Crop” MY 2022/23 U.S. Wheat Balance Sheet

The September 1st grain stocks estimate for All U.S. Wheat of 1.776 billion bushels was near pre-report trade estimates, and in itself was interpreted as neutral toward prices by the grain trade.

However, all U.S. 2022 Winter Wheat production of 1.304 bb was below the lower end of the range of pre-report trade expectations, based on lower planted and harvested acres and on reduced yields.

Similarly, 2022 Other Spring Wheat production of 482.2 mb was below the lower end of the range of pre-report trade expectations, based on low planted and harvested acres, and on reduced yields.

The production of 2022 U.S. Durum wheat production of 63.981 thousand bushels was below the lower end of the range of pre-report trade expectations, due mainlly to lower planted and harvested acres.

Taken together, these combined 2022 U.S. wheat production estimates by class were interpreted as supportive of U.S. wheat market prospects on tighter supplies.

The USDA estimated there to be a cumulative 137 million bushel decline in the USDA’s estimate of the 2022 U.S. wheat crop – down to 1.650 bb. Combined with a 9 mb increase in June 1st 2022 beginning stocks, and assuming no other changes in the “new crop” 2022/23 marketing year supply-demand balance sheet, a 124 mb drop in Ending Stocks for “new crop” MY 2022/23 – down to 486 mb, with a decline in percent ending stocks-to-use to 25.01% (down from 31.39% in the September 12th USDA World Agricultural Supply and Demand Estimates (WASDE) report). This projection of 25.01% ending stocks-to-use would be a 10 year low – since 24.24% in MY 2013/14.

Wheat Market Impacts: In an already extremely tight Global wheat supply-demand situation, this reduction in U.S. wheat supplies and stocks is likely to only exacerbate the short supplies situation, and provide all that much stronger support for already record high priced wheat markets in the U.S. in coming months. IF dry conditions continue to hinder seeding prospects in October in the U.S. central and southern plains, THEN at risk production prospects for 2023 U.S. wheat production will strongly support U.S. and global wheat markets into 2023. It is likely that the USDA may “ration” (i.e., reduce) its projections of exports and/or feed and residual usage for U.S. wheat in it’s upcoming October 12th USDA Crop Production report.

C. Larger 2021 U.S. Soybean Production & “Old Crop” 2021/22 End Stocks Soften “New Crop” MY 2022/23 Market Prospects

The September 1st grain stocks estimate for U.S. soybeans of 273.8 million bushels was higher than the upper end of pre-report trade estimates, and was interpreted by the grain trade as negative toward soybean market price prospects.

The USDA estimated there to be a 30 million bushel increase in the USDA’s estimate of the 2021 U.S. soybean crop – up to 4.465 billion bushels (bb). It also reduced Feed and Residual Use in “old crop” MY 2021/22 by 4 million bushels (mb) – down to 12 mb. Together, these changes in the U.S. Soybean supply-demand balance sheet brought about a total 34 mb increase in Ending Stocks for “old crop” MY 2021/22 – up to 274 mb, with a marginal increase in percent ending stocks-to-use to 6.14% (up from 5.37% in the September 12th USDA World Agricultural Supply and Demand Estimates (WASDE) report).

Assuming that beginning stocks in “new crop” MY 2022/23 would now also be 274 mb, and that all other supply-demand factors are unchanged, projected ending stocks in “new crop” MY 2022/23 would increase to 234 mb (vs 200 mb in the September 2022 WASDE), with percent ending stocks-to-use increasing from 4.51% in September 2022 to 5.28%. This projection of 5.28% ending stocks-to-use for “new crop” MY 2022/23 would still be a 7 year low – compared to 4.99% in MY 2015/16.

Soybean Market Impacts: On September 30th – the day of the release of the USDA Grain Stocks and annual Small Grains Summary report – lead contract CME November 2022 Soybean futures declined $0.46 per bushel – showing the negative response of the market to this news and likely other additional factors.

Questions still remain on the size of 2022 U.S. soybean production. If the USDA estimate of 2022 U.S. soybean production is significantly reduced again by the USDA in the October 12th USDA Crop Production report, then EITHER a) projected U.S. soybean stocks could decline again toward or below 200 mb, OR b) market prices could rise enough to “ration” or “limit” usage for U.S. soybeans to preserve a minimal amount of ending stocks through August 31, 2023 (the end of “new crop” MY 2022/23).

Following are the supportive working slides and notes for this analysis and interpretation of the USDA’s September 30, 2022 Grain Stocks and Small Grains Summary reports, as provided by Kansas State University:

“Extremely Tight World Crop Supply-Demand” Illustrated by KSU Graphics at K-State AG Lender Conferences, September 27-28, 2022

As part of a presentation on “2023 Grain Market Outlook” at a series of two KSU Agricultural Lenders Conferences on September 27-28, 2022 in western and eastern Kansas (sponsored by the Kansas State University Department of Agricultural Economics, Daniel O’Brien of KSU Ag Econ, illustrated and discussed the tightness of supply-demand balances for global corn, coarse grains, wheat and soybeans. The complete presentation is available at the following web address:

2023 Grain Market Outlook by Daniel O’Brien

Following are O’Brien’s key graphics as evidence of the tightness of global grain supply-demand balances for Corn, Coarse Grains (including Corn), Wheat, Soybeans & Sunflower:

“Ten Key Factors in 2023 Grain Markets” K-State AG Lender Conferences, September 27-28, 2022

A discussion of “Ten Key Factors in 2023 Grain Markets” was presented a series of two KSU Agricultural Lenders Conferences on September 27-28, 2022, one each in western and eastern Kansas. These meetings were sponsored by the Kansas State University Department of Agricultural Economics, with the first meeting on 9/27 in Southwest Kansas at Garden City, and the second on 9/28 in Manhattan in eastern North Central Kansas. This grain market information was presented by Daniel O’Brien of KSU Ag Econ, with other topics discussed at these meetings available on the www.AgManager.info website at the following web address: https://www.agmanager.info/events/ag-lenders-conferences/2022-ag-lenders-conference-presentations

The list of Topics discussed at these Conferences include:

Kansas Land Values and Trends by Robin Reid

Nontraditional Lending in Agricultural Markets by Jenny Ifft

The U.S. Macro-economy and Interest Rates by Brian Briggeman

Starting a Conversation on Farm Succession Planning by Ashlee Westerhold

2023 Grain Market Outlook by Daniel O’Brien

Outlook for Irrigated and Non-Irrigated Cash Rents in Kansas by Greg Ibendahl

Following are the list of “Ten Key Factors in 2023 Grain Markets” as presented and discussed by Daniel O’Brien…..

Weekly Grain Market Review on Friday, 9/9/2022 (by Kansas State University)

The Weekly Grain Market Review for Friday, September 9, 2022 is provided by KSU Extension Agricultural Economist Daniel O’Brien. Once again grain futures continued to be extremely volatile during the week of Monday, September 5th through Friday, September 9th.

The attention of the grain markets will be mainly on the USDA Crop Production and World Agricultural Supply and Demand Estimates reports to be released on Monday, September 12th at 11:00 a.m. central time. In the notes below are the pre-report trade estimates of the USDA 2022 corn and soybean yield and production numbers as of September 1st – with major implications for the “new crop” 2022/24 marketing year supply-demand balances and price expectations. It promises to be a very volatile day in the grain markets on Monday!

Following are the supportive working slides and notes for the Weekly Grain Market Review from Kansas State University (updated through Friday, September 9, 2022):

KSU Weekly Grain Market Review (Monday, May 9, 2022) – Futures, Grain Cash and Basis

The Weekly Grain Market Review for Monday, May 9, 2022 is provided by KSU Extension Agricultural /Economist Daniel O’Brien. This information is also available on the www.AgManager.info website at the following web address: https://www.agmanager.info/grain-marketing/grain-market-outlook-newsletter

A recording of the interview between Eric Atkinson and Daniel O’Brien can be listened at the following address on the www.AgManager.info website: https://www.agmanager.info/news. Following are the supportive working slides and notes for the Weekly Grain Market Review from Kansas State University:

The Corn Market Situation and 2023 Prospects

This Weekly Grain Market Review for Friday, December 16, 2022 is provided by KSU Extension Agricultural Economist Daniel O’Brien. The USDA World Agricultural Outlook Board (WAOB) released it’s latest World Agricultural Supply and Demand Estimates (WASDE) on December 9th.

I. A Corn Market Overview

Until the next set of USDA reports on Thursday, January 12th, there will be little U.S. crop production information available to impact the corn market. Foreign corn supply issues are more at risk because of concerns about weather-effected corn production prospects in Argentina and Brazil. Argentina corn prospects are particularly of concern given dry conditions that have already diminished crop production prospects there.

Rather, U.S. and foreign corn demand / usage issues are likely to predominate the corn markets attention – particularly in the U.S. where corn exports have been weak. There are concerns about how a possible or “likely” U.S. recession in 2023 or 2024 may negatively impact U.S. ethanol usage and associated domestic corn usage. Livestock feed usage is expected to down 7.3% to 5.300 billion bushels (bb) in “current” MY 2022/23 from the previous marketing year with high feed purchase costs, drought in the western Corn Belt, and other factors diminishing feed usage. Fertilizer availability issues are likely to impact corn and other crop production prospects in Europe, Ukraine, possibly in South America and elsewhere. Renewed Chinese problems with COVID-19 is having a negative impact on Chinese corn import purchases – specifically from the United States whereas purchases from South American countries have been preferred (and less burdened by high currency exchange rates unlike with the U.S. Dollar).

II. Seasonal Factors Driving 2023 Corn Market Prospects (Given what is known today)

Unless significant South American corn production risks emerge in Brazil to go along with what already has occurred in Argentina, it is likely that U.S. corn market prices will behave in a seasonal sideways-to-higher manner until domestic seasonal crop production uncertainty becomes a concern in Spring 2023. Other unforeseen usage factors could of course occur, but at this time the market’s expectations for U.S. ethanol corn use and livestock feeding are “baked in” to the market.

It IS possible that the in coming USDA WASDE reports that U.S. export demand could remain so weak that the USDA is forced to reduce its U.S. corn export projection further yet – which ceteris paribis (all else being equal) would lead to higher forecasts of U.S. corn ending stocks in “current” MY 2022/23. AND it is ALSO possible that Ukraine-Russia conflicts could lead to renewed international and U.S. concerns about the availability of food supplies in the coming year – raising prices again to “fear and risk” induced higher prices. But that the present time, the global corn market is not “pricing” these possibility into corn cash and futures market – in a bit of a “first – show me!” corn market narrative.

Prospects are for the LaNina weather pattern to weaken somewhat in spring 2022. IF this occurs, it MAY help alleviate the dry conditions that have plagued parts of the U.S. Corn Belt the last couple of years – particularly in the central and southern plains region.

III. Corn Market Situation as of Friday, December 16, 2022

A. Futures: Corn market futures prices have generally been trending downward in early October 2022 at highs near $7.10 per bushel, with MARCH 2023 Corn futures closing at $6.53 /bu on Friday, December 16th.

B. Kansas Cash Corn Prices and Basis: Cash corn basis levels at the end of last week have continued to be extremely strong, ranging from +$1.35 /bu over ($7.88 cash) in southwest Kansas (Garden City area), to +1.00 /bu over ($7.53 /bu cash) in northwest (Colby) and southeast (Columbus), +$0.80 to +$0.90 over ($7.33-$7.43 /bu cash) in north central (Salina) and south central (Hutchinson), and +$0.62 /bu over ($7.15 /bu cash) in east central – northeast Kansas.

C. Ethanol Plant Corn Prices: Corn prices at ethanol plants continue to be high, with Kansas corn input purchase prices of $7.150 to $7.6850 per bushel (average = $7.4350 /bu), with basis levels ranging from +$0.65 to +$1.15 /bu over MARCH 2023 Corn on December 16th. Nebraska ethanol plant prices for corn averaged $7.0797 /bu, followed by western Iowa at $6.9068 /bu, and $6.86 /bu in Missouri. Other eastern and northern Corn Belt ethanol plant corn input prices ranged from $6.2590 to $6.7312 /bu. Short crop 2022 drought impacts in the western Corn Belt are reflected in higher Kansas and Nebraska ethanol plant bids.

D. U.S. Corn Exports – Shipments and Total Purchases: The USDA Foreign Agricultural Service (FAS) reported total U.S. corn export shipments through 12/8/2022 of 286.0 million bushels, equal to a “bearish” 13.78% of the USDA projection of 2.075 billion bushels (bb) for the “current” 2022/23 marketing year, with the marketing year 26.9% of the way completed (14 of 52 weeks). Total U.S. Corn Shipments plus Forward Purchases on 12/8 equal 787.5 million bushels, equal to a “neutral” 38.0% of the USDA projection of 2.075 bb, with 26.9% of the current marketing year.

E. U.S. Corn % Ending Stocks-to-Use: From MY 2017/18 through MY 2019/20, United States Corn % ending stocks-to-use declined from 14.5% to 15.5% down to 13.7%, respectively. Then, after dropping sharply to 8.3% in MY 2020/21, % United States corn stocks/use is projected to be 9.2% in “old crop” MY 2021/22 and 8.9% in “current” MY 2022/23 – this through the December 9th World Agricultural Supply and Demand Estimates (WASDE) report.

F. World-less-China Corn % Ending Stocks-to-Use: From MY 2017/18 through MY 2019/20, World-less-China Corn % ending stocks-to-use ranged from 14.3% to 12.7% down to 12.3%, respectively. Then, after dropping sharply to 10.1% in MY 2020/21, % World-less-China corn stocks/use is projected to be 10.8% for both “old crop” MY 2021/22 and “current” MY 2022/23 – through the December 9th WASDE report.

G. U.S. Average Farm Level Corn Prices: From MY 2017/18 through MY 2019/20, U.S. average farm level corn prices ranged from $3.36 up to $3.61 and $3.56 /bu, respectively. Then, U.S. corn prices increased sharply to $4.53 /bu in MY 2020/21, $6.00 /bu in “old crop” MY 2021/22, and to a projected price of $6.70 /bu in “current” MY 2022/23 (source: December 9th WASDE report.)

………

Following are the supportive working slides and notes for the Weekly Grain Market Review from Kansas State University (updated through market trades on Friday, December 16, 2022):

U.S. Ethanol Market Trends and Profitability through Mid-Late October 2022

Daniel M. O’Brien – Professor and Extension Agricultural Economist, Kansas State University Department of Agricultural Economics

A. Ethanol Price and Profitability Trends – Through October 17, 2022

Ethanol Sales Prices (per gallon): The selling price of ethanol via tank car and truck shipment out of Iowa ethanol plants is estimated to have averaged near $2.4150 / gallon during the period of October 1-17, 2022. This compares to approximately $2.39 /gallon during September 2022.

  • Corn Input Purchase Prices (per bushel): During September and the October 1-17, 2022 period, corn input purchase prices for Iowa ethanol plants are estimated to have averaged $7.11 and near $6.90 /bu., respectively.
  • DDGS Market Prices (per ton at 10% moisture): Also during September and the October 1-23, 2022 periods, distillers dried grains (DDGS) prices (10% moisture) for Iowa ethanol plants are estimated to have averaged near $254.98 and $251.53 per ton, respectively. 
  • Ethanol Cost of Production (per gallon): For the same September and October 1-17, 2022 periods, cost of production for Iowa ethanol plants is estimated to have averaged near $2.46 and $2.39 per gallon, respectively.
  • Profitability of Ethanol Production (per gallon): Using an Iowa State University model and applying input cost and product price estimates from the USDA Agricultural Marketing Service, ethanol plants in Iowa were operating on average at estimated losses of ($0.07) and ($0.05) per gallon during September and October 1-17, 2022, respectively.
  • Corn Estimated Processing Value (EPV) is calculated by adding the total value from Ethanol, Dried 10% Distillers Grains, and Distillers Corn Oil. During September 2022 at Iowa Ethanol Plants the corn EPV averaged $9.35 1/4 per bushel, declining marginally to $9.21 /bushel during October 1-17.
  • Distillers Corn Oil Value per gallon of Ethanol: At an average value of essentially $0.44 per bushel of corn used in ethanol production during September-October 17, 2022, the value of Corn Oil per gallon is calculated by dividing $0.44 / bu by 2.83 gallons/bu, equaling approximately $0.1555 added income per gallon of ethanol produced, all else being equal. 
    • For ethanol plants that do produce Distillers Corn Oil, projected losses of -$0.07 per gallon in September 2022 without corn oil revenues may come near to profits of approximately +$0.08 per gallon for the month. 
    • Similarly, for the October 1-17 period, projected losses of -$0.05 per gallon  without corn oil revenues may come near to profits of approximately +$0.10 per gallon for the period

******

Following are some graphics on U.S. Ethanol Market price and profitability trends.